Solidblocks RDS PostgreSQL is a ready to use, all-batteries included Terraform module for deploying PostgreSQL databases to the Hetzner cloud. It is part of the Solidblocks library, which is a collection of reusable components for infrastructure operation, automation and developer experience.
And it has a performance issue.
The typical uses case until now was a simple and cheap PostgreSQL database for smaller workloads that do not see a lot of traffic and only need a single node database with reliable backup and restore. Recently I got some feedback on unexplainable performance drops during elevated load situations for databases with a size of around 100GB on small to medium-sized cloud VMs.
This post is the first part of the journey to debug and resolve this problem while highlighting some aspects to watch out for when analyzing situations like this.
Keeping the context where Solidblocks RDS PostgreSQL is typically used in the back of our head we will try to solve this issue with on-board resources, assuming we do not have the advantage of a full-blown monitoring solution that your normally see in larger environments.
As always the full code is available online here github.com/pellepelster/kitchen-sink/postgres-performance-debugging. The folder contains a do file to start all tasks needed to follow the examples in this post. A Hetzner cloud account is needed to follow this code.
Reproduce
The first step in solving this issue is to create a reproducible environment that can be used to debug the issue, and also to verify the fix if one is found.
Because we will likely re-run and re-create the reproduce several times, it makes sense to invest some time into automating it. Not only will this help us with running the tests in different configurations, but this also creates the opportunity to throw away and re-create everything from scratch in case we run into in a dead-end during debugging or corrupt the test environment along the way.
Environment
Since Solidblocks RDS PostgreSQL is a Terraform module, we will of course use Terraform to create the test environment. In our case this can be done with just a simple module invocation to deploy the database.
module "postgresql" {
  source  = "pellepelster/solidblocks-rds-postgresql/hcloud"
  version = "0.2.5"

  name     = "postgresql"
  location = var.location
  ssh_keys = [hcloud_ssh_key.ssh_client_identity.id]

  server_type = var.instance_type

  backup_volume = hcloud_volume.backup.id
  data_volume   = hcloud_volume.data.id

  public_net_ipv4_enabled = true

  databases = [
    { id : "pgbench", user : "pgbench", password : "pgbench" }
  ]
}
Variables, parameters and scenarios
To be able to verify different approaches when solving the performance issue it is helpful to have configuration options for the key tunable parts of the environment that can be parametrized from the outside to test different theories. For example in our case the instance_type type is a good candidate that we might need to tune to test the database on different machine sizes. We can externalize this with a Terraform variable definition:
variable "instance_type" {
  type    = string
}
With more and more parameters (and this will inevitably happen) the next problem we face is how we can combine different parameters into scenarios that we can re-run anytime we want.
To not go overboard with a too complex solution we will use a simple file with environment variable declarations:
POSTGRESQL_INSTANCE_SIZE=ccx13
PGBENCH_INIT_SCALE=10000
PGBENCH_TIME=1800
PGBENCH_AGGREGATION_INTERVAL=5
PGBENCH_JOBS=8
PGBENCH_CLIENTS=50
This file can be parsed and exported with a ensure_scenario function that is called before the provisioning/testing code is started. To avoid confusion it is also a good idea to print the scenario configuration for the current run. Inserting dividers (divider_[bold|thin]) help to structure the console output and makes it easier for the developer to find the important parts in the log stream.
function ensure_scenario() {
  SCENARIO="${1:-}"

  if [[ -z "${SCENARIO}" ]]; then
    echo "no scenario provided"
    exit 1
  fi

  if [[ ! -f "${DIR}/scenarios/${SCENARIO}" ]]; then
    echo "scenario '${SCENARIO}' not found"
    exit 1
  fi

  divider_bold
  echo "loading scenario '${SCENARIO}'"
  export $(grep -v '^#' "${DIR}/scenarios/${SCENARIO}" | xargs)
  divider_thin
  echo "postgresql instance type: ${POSTGRESQL_INSTANCE_SIZE}"
  echo "pgbench init scale: ${PGBENCH_INIT_SCALE}"
  echo "pgbench run time: ${PGBENCH_TIME}"
  echo "pgbench aggregation interval: ${PGBENCH_AGGREGATION_INTERVAL}"
  echo "pgbench clients: ${PGBENCH_CLIENTS}"
  echo "pgbench jobs: ${PGBENCH_JOBS}"
  divider_bold
  echo ""
}
Putting everything together in a deployment task like this:
function task_hetzner_deploy() {
  ensure_scenario "${1:-}"
  echo ""

  divider_bold
  echo "deploying postgresql database with instance size '${POSTGRESQL_INSTANCE_SIZE}'"
  divider_thin
  export TF_VAR_instance_type=${POSTGRESQL_INSTANCE_SIZE}
  hetzner_terraform init -upgrade
  hetzner_terraform apply -auto-approve -target hcloud_volume.backup
  hetzner_terraform apply -auto-approve -target hcloud_volume.data
  hetzner_terraform apply -auto-approve
  divider_bold
}
We can now deploy various scenarios like this:
./do hetzner-deploy scenario1

==================================================================================================
loading scenario 'scenario1'
--------------------------------------------------------------------------------------------------
postgresql instance type: ccx13
pgbench init scale: 1000
pgbench run time: 900
pgbench aggregation interval: 1
==================================================================================================

==================================================================================================
deploying postgresql database with instance size 'ccx13'
--------------------------------------------------------------------------------------------------

Initializing the backend...
Upgrading modules...
Downloading registry.terraform.io/pellepelster/solidblocks-rds-postgresql/hcloud 0.2.5 for postgresql...
- postgresql in .terraform/modules/postgresql

Initializing provider plugins...
- Finding latest version of hashicorp/template...
- Finding latest version of hashicorp/local...
- Finding latest version of hashicorp/tls...
- Finding hashicorp/http versions matching ">= 3.3.0"...
- Finding hetznercloud/hcloud versions matching ">= 1.38.2, 1.46.1"...

[...]
Load-Driver
Now that we have an environment to test we need a load driver to create put some stress on the database. Luckily for us with PostgreSQL already contains a nice load generation tool called pgbench.
pgbench is a simple program for running benchmark tests on PostgreSQL. It runs the same sequence of SQL commands over and over, possibly in multiple concurrent database sessions, and then calculates the average transaction rate (transactions per second). By default, pgbench tests a scenario that is loosely based on TPC-B, involving five SELECT, UPDATE, and INSERT commands per transaction.
A load scenario using pgbench is deployed in two steps, first the database is initialized with a configurable amount of data, then a variable number of jobs are spawned that will open PostgreSQL connections and run the aforementioned SQL statements.
Initialize the database
pgbench --initialize will create the following table structure filled with random data.
table                   # of rows
---------------------------------
pgbench_branches        1
pgbench_tellers         10
pgbench_accounts        100000
pgbench_history         0
By supplying a --scale the amount of data can be multiplied. This is crucial for our benchmark, because every test cycle at least updates pgbench_branches and when that table is too small we will very likely run into locks while updating that table.
For our test scenario we will choose 10.000 as scale factor and initialize the database with:
./do hetzner-pgbench-init scenario1
which roughly translates to the following table and index sizes:
    table_name    | Index Size | Table Size
------------------+------------+------------
pgbench_accounts  | 21 GB      | 125 GB
pgbench_tellers   | 2208 kB    | 4328 kB
pgbench_branches  | 240 kB     | 360 kB
pgbench_history   | 0 bytes    | 0 bytes
Fitting perfectly the scenario from the initial problem description.
Run the benchmark
To run the benchmark we will use a second provisioned machine running in the cloud, to rule out the influence of our local machine and internet connection. A key aspect here is also to have a test environment that is as consistent as possible, so our number are now skewed by outside influences. Also, because the services accessing the database run in the cloud as well, this as well make the test setup more realistic.
resource "hcloud_server" "pgbench" {
  name        = "pgbench"
  server_type = "ccx13"
  image       = "debian-11"
  location    = var.location
  user_data   = <<EOT
#!/usr/bin/env bash
apt-get update
apt-get install -y postgresql-contrib
EOT
  ssh_keys    = [hcloud_ssh_key.ssh_client_identity.id]
}
Now we can run pgbench against our database to measure the TPS (transactions per second) which should give us a good indication of the databases baseline performance.
Main tuning parameters for the performance measurement are --client and --jobs which represent the amount of clients to simulate, respectively the amount of jobs (think processes) to spread on the machine driving the loadtest. We will start with 50 and 8 for those parameters, while keeping an eye on the machine running the benchmark. The goal here is not to maximize the TPS to the absolute limit, but go get a stable reproduce for the issue.
A third important parameter is --time which designates the total run time of the benchmark. This is particular important in our case, because looking at all the layers of our setup that may impact the databases performance, to get reliable number we want everything warmed up to avoid influences from caches or other components of the stack that may cause performance bursts. For the created logfiles of the benchmark run --aggregate-interval will determine how often new entries are added to the logile.
Since we might want to rerun the benchmark several times under different conditions with different potential fixes, we manually assign each run a test id that makes it easier to identify the different test artifacts afterward, which will be stored in the results/<scenario>/<test_id> folder. This folder will also contain all artifacts created during the test, as well as the test configuration itself, logfiles and other auxiliary information. This will make reasoning about the test results easier, especially in an environment where multiple people are looking at the same task
When run with
./do hetzner-pgbench-run scenario1 test1
After the --time is up, it will lease is with some logfiles, one for each --jobs named <scenario>_<test_id>.<process_id>.<job>, that we can download with
./do hetzner-pgbench-logs scenario1 test1
into the results folder results/<scenario>/<test_id>.
Visualize the results
Although pgbench prints the current performance stats during runtime it is beneficial to visualize the results from the logfiles, because that makes it easier to discover patterns and maybe also establish relations between different measurements.
The log format is well documented in the pgbench man page, and looks like this:
1714330256        511               30412731      3289102271193   12509         455582
1714330261        641               34874800      2519104192570   10392         210369
1714330266        645               34944016      2487048817300   9193          212293
1714330271        644               35059294      2743728489356   11539         282776
1714330276        571               33111218      5443765824910   10550         736992
1714330281        634               36907119      3992775957871   11316         505375
<interval_start> <num_transactions> <sum_latency> <sum_latency_2> <min_latency> <max_latency>
As a starting point we might want to visualize the TPS to get an rough overview how much the performance varies.
Lacking a full-blown metrics collection and visualization solution like Grafana we will resort to rrdtool which despite being a bit dated and admittedly a little arcane to use, still provides an easy way to aggregate and visualize time-series data.
To be able to graph timeseries with rrdtool you have to follow a three-step process, first step is to define the database that will contain the data, and tell rrdtool what kind of datasource (DS) to expect in what interval and tell it how to store it in and round-robin archive (RRA).
rrdtool create "<job_n>.rrd" DS:<job>:GAUGE:<aggregate-interval>:U:U RRA:AVERAGE:0.5:1:1200
This will create a single RRD file with one datasource named <job>, the datasource will be a Gauge TODO, the two appended U specify the maximum and minimum value which we don’t care for in our case and leave it TODO. We could also create multiple DS one for each job in a single RRD file, but this would complicate the already nearly unreadable shell script.
Next step is to parse the logfiles, and add the TPS values to the RRD database with:
rrdtool update "<job_n>.rrd" "<interval_start>:<num_transactions>"
We will not go into the depth of the awk/sed based parsing here, see the task_hetzner_pgbench_graph in the do file for that, just a mild warning (as always): Don’t use too much bash, it will become unmaintainable very quick and very hard. My reasoning for this case this is, that as a one-off or during the exploration phase, hacking together something in bash is ok, but if you want to use it more often or maybe make the performance check a part of your CI pipeline, do it in an appropriate language.
Now finally in a (slightly) simplified way we can use the generated RRD databases to generate a graph for the overall TPS:
rrdtool graph <test_id>_tps.png \
--title "<scenario> <test_id>" \
--vertical-label "TPS" \
DEF:<job_1>=<job_1>.rrd:<job_1>:AVERAGE AREA:<job_1>#<color1>:<job_1>:STACK \
DEF:<job_2>=<job_2>.rrd:<job_2>:AVERAGE AREA:<job_2>#<color2>:<job_2>:STACK \
[...]
Where we first DEFine each created RRD database with a distinct name for each <job> and then create an AREA visualisation for each <job> TPS with a distinct random color (see local colors=("#808080", [...] in the do file). By STACKing all the areas we also can easily see the total TPS for the whole system, which looks like this:
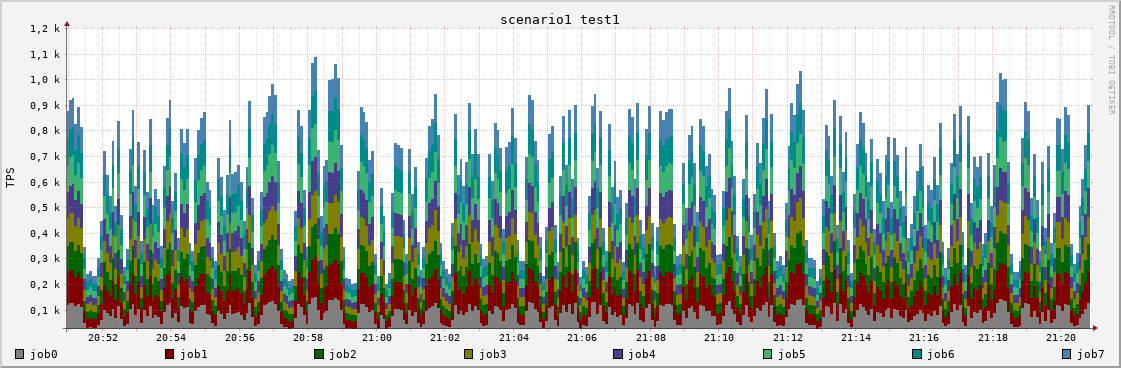
At a first glance at the TPS graph we can see that the TPS performance seems to vary by nearly ~700 TPS alternating between ~900 TPS and ~200 TPS. While this is admittedly a bad situation we now have a stable reproduce and are able to verify any fix that we can think of, which will we will do in the second part.